
TL;DR
- Track operational workforce planning metrics to know team size, skills and gaps.
- Metrics replace staffing guesses with clear numbers.
- Focus on capacity, cost, quality and agility.
- Use metrics to refine your workforce management plan and schedule.
- Avoid overload and track only what drives action.
Picture a hectic work floor where half your operational employees are handling the wrong jobs. Some areas have too many people while others do not have enough. The schedule feels scrambled with gaps everywhere. That’s what happens when operational planning and management run without clear data. Output falls, expenses climb and team spirit fades fast.
Now flip the scenario: you have a set of well-defined metrics guiding your operational workforce planning so you always know the number of people, the skills needed (for example, in operation positions or for operational talent) and you can spot upcoming gaps before they grow. In this blog, you’ll learn how to define those metrics, why they matter, how to group them and how to turn them into real action.
What is Operational Workforce Planning?

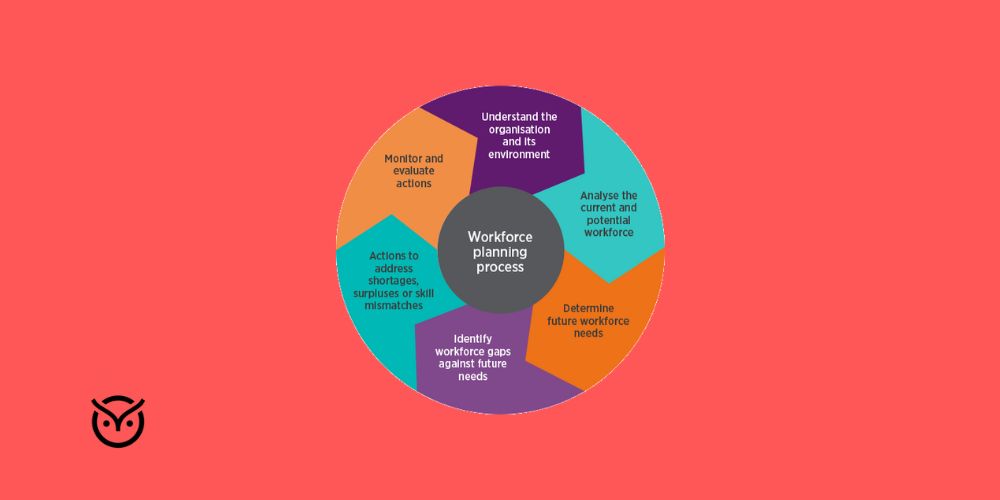
To start, let’s clarify what we mean by operational workforce planning. At its heart, this is the practice of ensuring the right number of people with the right skills are in the right place at the right time especially for day-to-day operations. In other words, you’re not only dealing with long-term strategic talent pipelines (though those matter) but with the concrete realities of scheduling, staffing, cost and productivity in operation positions.
If you’re asking “what is an operational planning” scenario, it’s the subset of your planning process focused on short to medium-term staffing demands: shifts, peak times, special projects, skill gaps. This becomes part of a larger workforce management plan which is one component of how you align human resources with business demands. According to the CIPD factsheet, workforce planning involves analyzing current workforce supply, forecasting future demand, identifying gaps and making decisions that help you match staff to tasks.
Team Balancer
Move the slider to see what staffing balance looks like.
Work fits the team. Breaks happen. Service levels hold steady.
Why Metrics Matter in Workforce Planning

If you do not track metrics then you’re basically flying blind. You might think you have enough staff but later discover big gaps at critical moments. You might assume your roster is enough but the cost numbers tell a different story. That’s where metrics come in: they give you facts not guesses.
For example, a recent blog on workforce planning showed there are 31 key metrics you should be aware of from headcount and tenure distribution to engagement and cost per hire. Without measuring, you won’t understand when your workforce planning and analytics need to kick in or when your workforce forecasting got it wrong.
And when metrics are turned into action, you get benefits. You can see where your workforce planning tools are weak, spot patterns of over-staffing or skill shortages and make a case for investing in new platforms or training. In short: metrics matter because they give you control, clarity and a real chance to drive improvement.
Blind or In Control?
Answer two quick questions to see your planning style.
You think your team has enough staff. What do you do?
Your overtime is up 20%. What’s your move?
Core Categories of Metrics to Track
When you’re working on your operational workforce planning, it helps to group metrics into meaningful categories. Here are some common buckets:
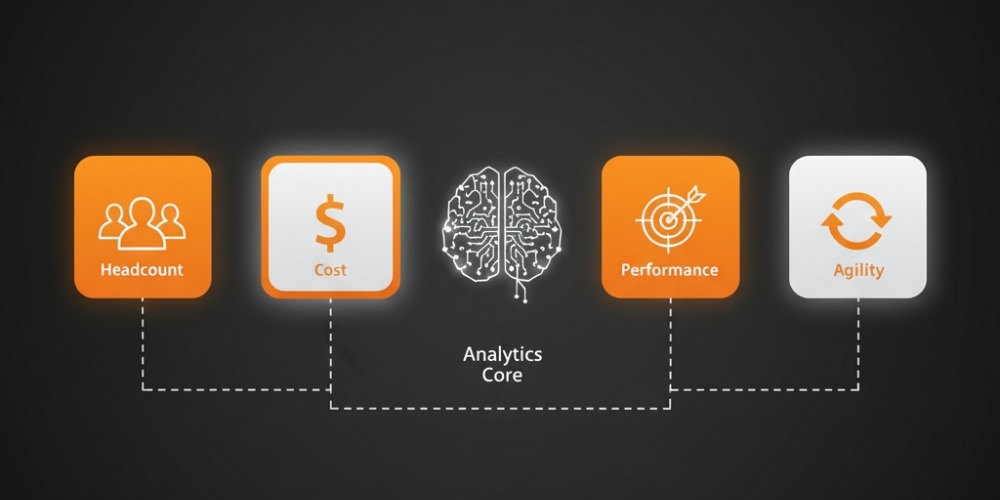
Capacity & Supply Metrics
This group covers how many people you have now, how many you need soon and whether you’re prepared. Examples: headcount, full-time equivalents, internal mobility rate.
Cost Metrics
What is this workforce costing you? Metrics might include cost per hire, overtime cost, premium pay or cost of vacant positions.
Quality & Performance Metrics
Simply having bodies isn’t enough. They must have the right skills, be productive and stay engaged. Metrics like time-to-hire, quality of hire and retention rate fall here.
Demand & Alignment Metrics
Here you match what you have to what you need: forecasting demand, measuring schedule fill-rate, coverage ratio (scheduled staff vs required staff) and turnaround time for staffing response.
Agility & Risk Metrics
In a world where change is constant (shifts in market, technology and roles), you need measures of flexibility. Example metrics: percentage of roles with no back-up, speed of shift reallocation, percentage of workforce ready for dynamic workforce planning changes.
Core Categories of Metrics to Track
Click a tile to see what it measures and why it matters.
Measures how many people you have compared to what’s needed.
Example: Headcount and shift coverage.
Tracks the financial effect of your staffing choices.
Example: Overtime costs and vacancy expenses.
Assesses skill level, engagement, and team results.
Example: Retention rate and performance scores.
Shows how quickly your team adapts to change.
Example: Shift flexibility and redeployment rate.
Turning Metrics Into Action

Metrics are useless if they sit in a dashboard collecting digital dust. Turning numbers into movement is where operational workforce planning shows its real power.
Start by linking every metric to a decision. For example, if your labor planning data shows repeated overtime in a specific team, the action could be adjusting the workforce scheduler to rebalance shifts or reassign cross-trained staff. When your absenteeism rate spikes, connect it with engagement surveys to understand the story behind it. Numbers point to problems but context gives meaning.
A smart workforce planning model should include not just how you measure but how you react. Set thresholds and triggers: if vacancy rate crosses 10% or time-to-fill passes 45 days, the operational planning team steps in. This approach transforms metrics into daily decision tools not quarterly reports.
Turning Metrics Into Action
Drag the blocks into the correct order
Tip Use data to form an insight, choose a decision, then take action.
Common Pitfalls in Workforce Metrics

Metrics can guide you or mislead you. Here are a few traps to avoid:
Tracking too many numbers.
Businesses love dashboards but not all numbers deserve space. A good rule is that if you cannot explain what action each metric drives, it’s not worth tracking. This avoids the “metric soup” problem that drowns your workforce management plan in noise.
Ignoring data quality.
Bad data equals bad planning. Without clean inputs such as accurate time logs, updated job codes and correct shift data, your operational employees will feel the chaos firsthand.
Forgetting to align metrics with business goals.
If your company’s focus is customer response time but your metrics only measure overtime, you’re missing alignment. Tie each metric to an organizational outcome so your operational talent feels the connection between their work and the company’s mission.
Confusing correlation with cause.
A drop in productivity might not mean staff performance issues. It could be due to system downtime or unclear job design. Always cross-check metrics with real-world context.
Common Pitfalls in Workforce Metrics
Tap a card, choose the answer, and reveal the reason.
The Role of Technology in Tracking Metrics

Technology is the quiet hero behind modern operational workforce planning. Advanced analytics and automation tools are reshaping how data turns into insight.
Today’s workforce planning tools combine scheduling, payroll and predictive models to build one data picture. Artificial intelligence and machine learning can now forecast attrition, workload spikes or training needs weeks in advance. What used to take manual analysis now happens in minutes.
When your workforce forecasting setup links with attendance logs, shift plans and performance data, it turns into the heart of a flexible and alert operational planning and management process. You stop reacting after problems appear and start spotting what’s ahead, ready to adjust before it lands.
The Role of Technology in Tracking Metrics
Match each challenge to the best tech solution. Get instant feedback.
Future of Metrics in Workforce Planning

The future of workforce metrics is personalization and precision. Instead of tracking everyone the same way, next-gen systems will adapt KPIs (key performance indicators) by role, location and even personality profile.
Expect to see more dynamic workforce planning where algorithms automatically adjust schedules or staffing levels based on real-time conditions such as project pipeline, customer demand or even weather.
As remote and hybrid work become normal, workforce development planning will also expand to cover digital skill readiness and employee adaptability. The next wave of metrics will not just ask, “How many people do we have?” but, “How capable are they of evolving with us?”
Future of Metrics in Workforce Planning
Vote agree or disagree. See live results instantly.
Conclusion
Strong operational workforce planning means tracking what matters, cutting what doesn’t and using your insights to act fast. It’s not about the most metrics. It’s about the right ones.
When metrics guide hiring, scheduling and engagement, your organization runs smoothly, teams feel balanced and budgets stay stable. You gain the benefits of workforce planning like improved retention, better forecasting accuracy and higher operational resilience.
FAQs
Focus on 15 to 20 core metrics. Enough to see the big picture but not so many that you lose sight of action.
Yes. Manufacturing focuses on shift coverage and overtime costs while tech might emphasize project velocity or contractor ratios.
Collecting data without linking it to a clear goal or decision. Metrics must drive outcomes not just reporting.
Leaders create accountability. They set the tone that workforce metrics are not punishment tools but signals for improvement.
Better planning means fewer surprises, less overtime, fewer vacancies and lower turnover which directly improves profitability.